
Call Center Performance Reporting – Operational Efficiency Analysis
- “Where are we strong?”
- “Where are we leaking value?”
- “Where can we unlock more sales and satisfaction?”
How Is Call Center Performance Measured?
- We don’t look only at call counts;
- We measure value per call, resolution, and sales impact together.
- • Call volume (daily/weekly/monthly)
- Answer rate and waiting times
- First Call Resolution (FCR)
- Talk time and cost per call
- Sales & reservation conversion rates
- Satisfaction scores (CSAT, NPS, etc.)
Summary
DGTLFACE measures call center KPIs such as call volume, answer rate, wait time, first call resolution, sales/reservation conversion, multi-channel interactions, and agent performance. By unifying data from phone, WhatsApp, DM, OTA, and other channels in Looker Studio dashboards, we generate actionable improvements—especially for hotel and tourism call centers—to optimize operations and increase revenue and satisfaction.
KPI Tracking and Call Center Analysis
Multi-Channel (Phone + Messaging + OTA) Performance Analysis
- Phone calls
- WhatsApp and web chat
- Instagram & social media messages
- OTA and Google/Yandex messages & reviews
- Which channel brings the most questions/complaints
- Which channel has the biggest sales opportunities
- Which hours/days have peak volumes
- Which languages show delays or quality issues
Performance Analysis Tailored for Hotels and Tourism Call Centers
- There are seasonal peaks,
- Market behaviors differ (DE, RU, EN, TR),
- The sales cycle is directly tied to reservations & occupancy.
- linking occupancy, revenue, reservations, and channel data with call center KPIs, For these outputs to be interpreted correctly on the operations side, the process should also be matched with Reservation Management
- measuring market/language performance (e.g., German-speaking conversion rate),
- running separate analysis for pre-season / in-season / post-season,
- reporting the impact of the OTA + web + call center combination.
DGTLFACE Call Center Performance Analysis Service Details

Data Collection and Integration
- Call center software
- Telephony/IVR systems
- CRM and PMS systems
- WhatsApp & social message infrastructure
- OTA and map platform data
Dashboard and Report Design
- Executive KPI summary (top view)
- Detailed call + channel + agent screens for operations managers
- Complaint & satisfaction screens for CX teams
- Revenue & conversion screens for sales teams

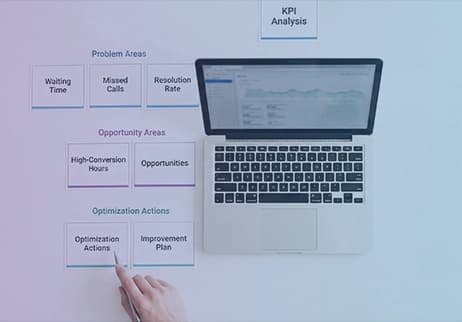
KPI Analysis and Optimization Recommendations
- Where are the problems? (wait time, missed calls, low resolution…)
- Where are the opportunities? (high-converting hours, markets, channels…)
- What do we gain by changing X? (shift planning, staffing, script improvements…)
Operational KPIs
- Total calls, answered/missed rates
- Average waiting time
- Average talk time
- In-hours / out-of-hours distribution
- Language and channel volume (TR, EN, DE, RU / phone, WhatsApp, etc.)

Why Call Center Performance Analysis with DGTLFACE?
Hybrid Expertise: Call Center + Tourism + Digital Analytics
- Call center operations: call center services, 4-language call center, reservation support
- Hotel & tourism know-how: hotel digital marketing, PMS-OTA management
- Data & dashboards: data analysis & reporting, Looker Studio, benchmark analysis, sales conversion
Antalya-Based, Focused on Tourism Call Centers
- works intensively with hotel & tourism call centers in and around Antalya,
- is experienced in seasonal call waves, campaign periods, and crisis scenarios,
- can evaluate local and international markets in a single view.
KPI-Based Management and Continuous Improvement Culture
- Weekly, monthly, and seasonal reporting cycles
- Executive summaries for management meetings
- Gap analysis between targets vs. actuals
- Recommendations at script, shift, staffing, channel, and technology levels
Micro Layer
Call Center Performance How Is It Measured? (Practical Summary)
- Define your KPI set (choose meaningful metrics—not just volume).
- Collect data cleanly across all channels.
- Build summary dashboards for leaders and detailed views for operations.
- Share results in weekly/monthly cycles with teams.
- Write down improvement actions and track them.
Inbound/Outbound Performance How Do You Build the Report?
- Call volume, missed calls, response time, resolution rate, satisfaction metrics
- Dial volume, reach rate, talk time, sales/conversion, channel & campaign results
Hotel Call Center Which KPIs Matter?
- Reservation conversion rate (call → booking)
- Call center contribution relative to RevPAR impact
- Market/language conversion rates
- Campaign-period call → booking impact
- Recovery success in no-show and cancellation flows
Multi-Channel Performance Why Do We Need It?
- Web chat
- Social media messages
- OTA and Google messages & reviews
DGTLFACE Hakkında Questions
See the most common questions about performance analysis at a glance.
Before deciding on call center KPIs, dashboard reading, and booking conversion analysis, review the Performance Analysis & Reporting FAQ page.
This information is compiled from DGTLFACE’s internal documentation and project work on call center performance reporting, Looker Studio dashboards, and tourism-focused operational analysis processes.