1. How should the executive dashboard be designed for managers?
Short answer:
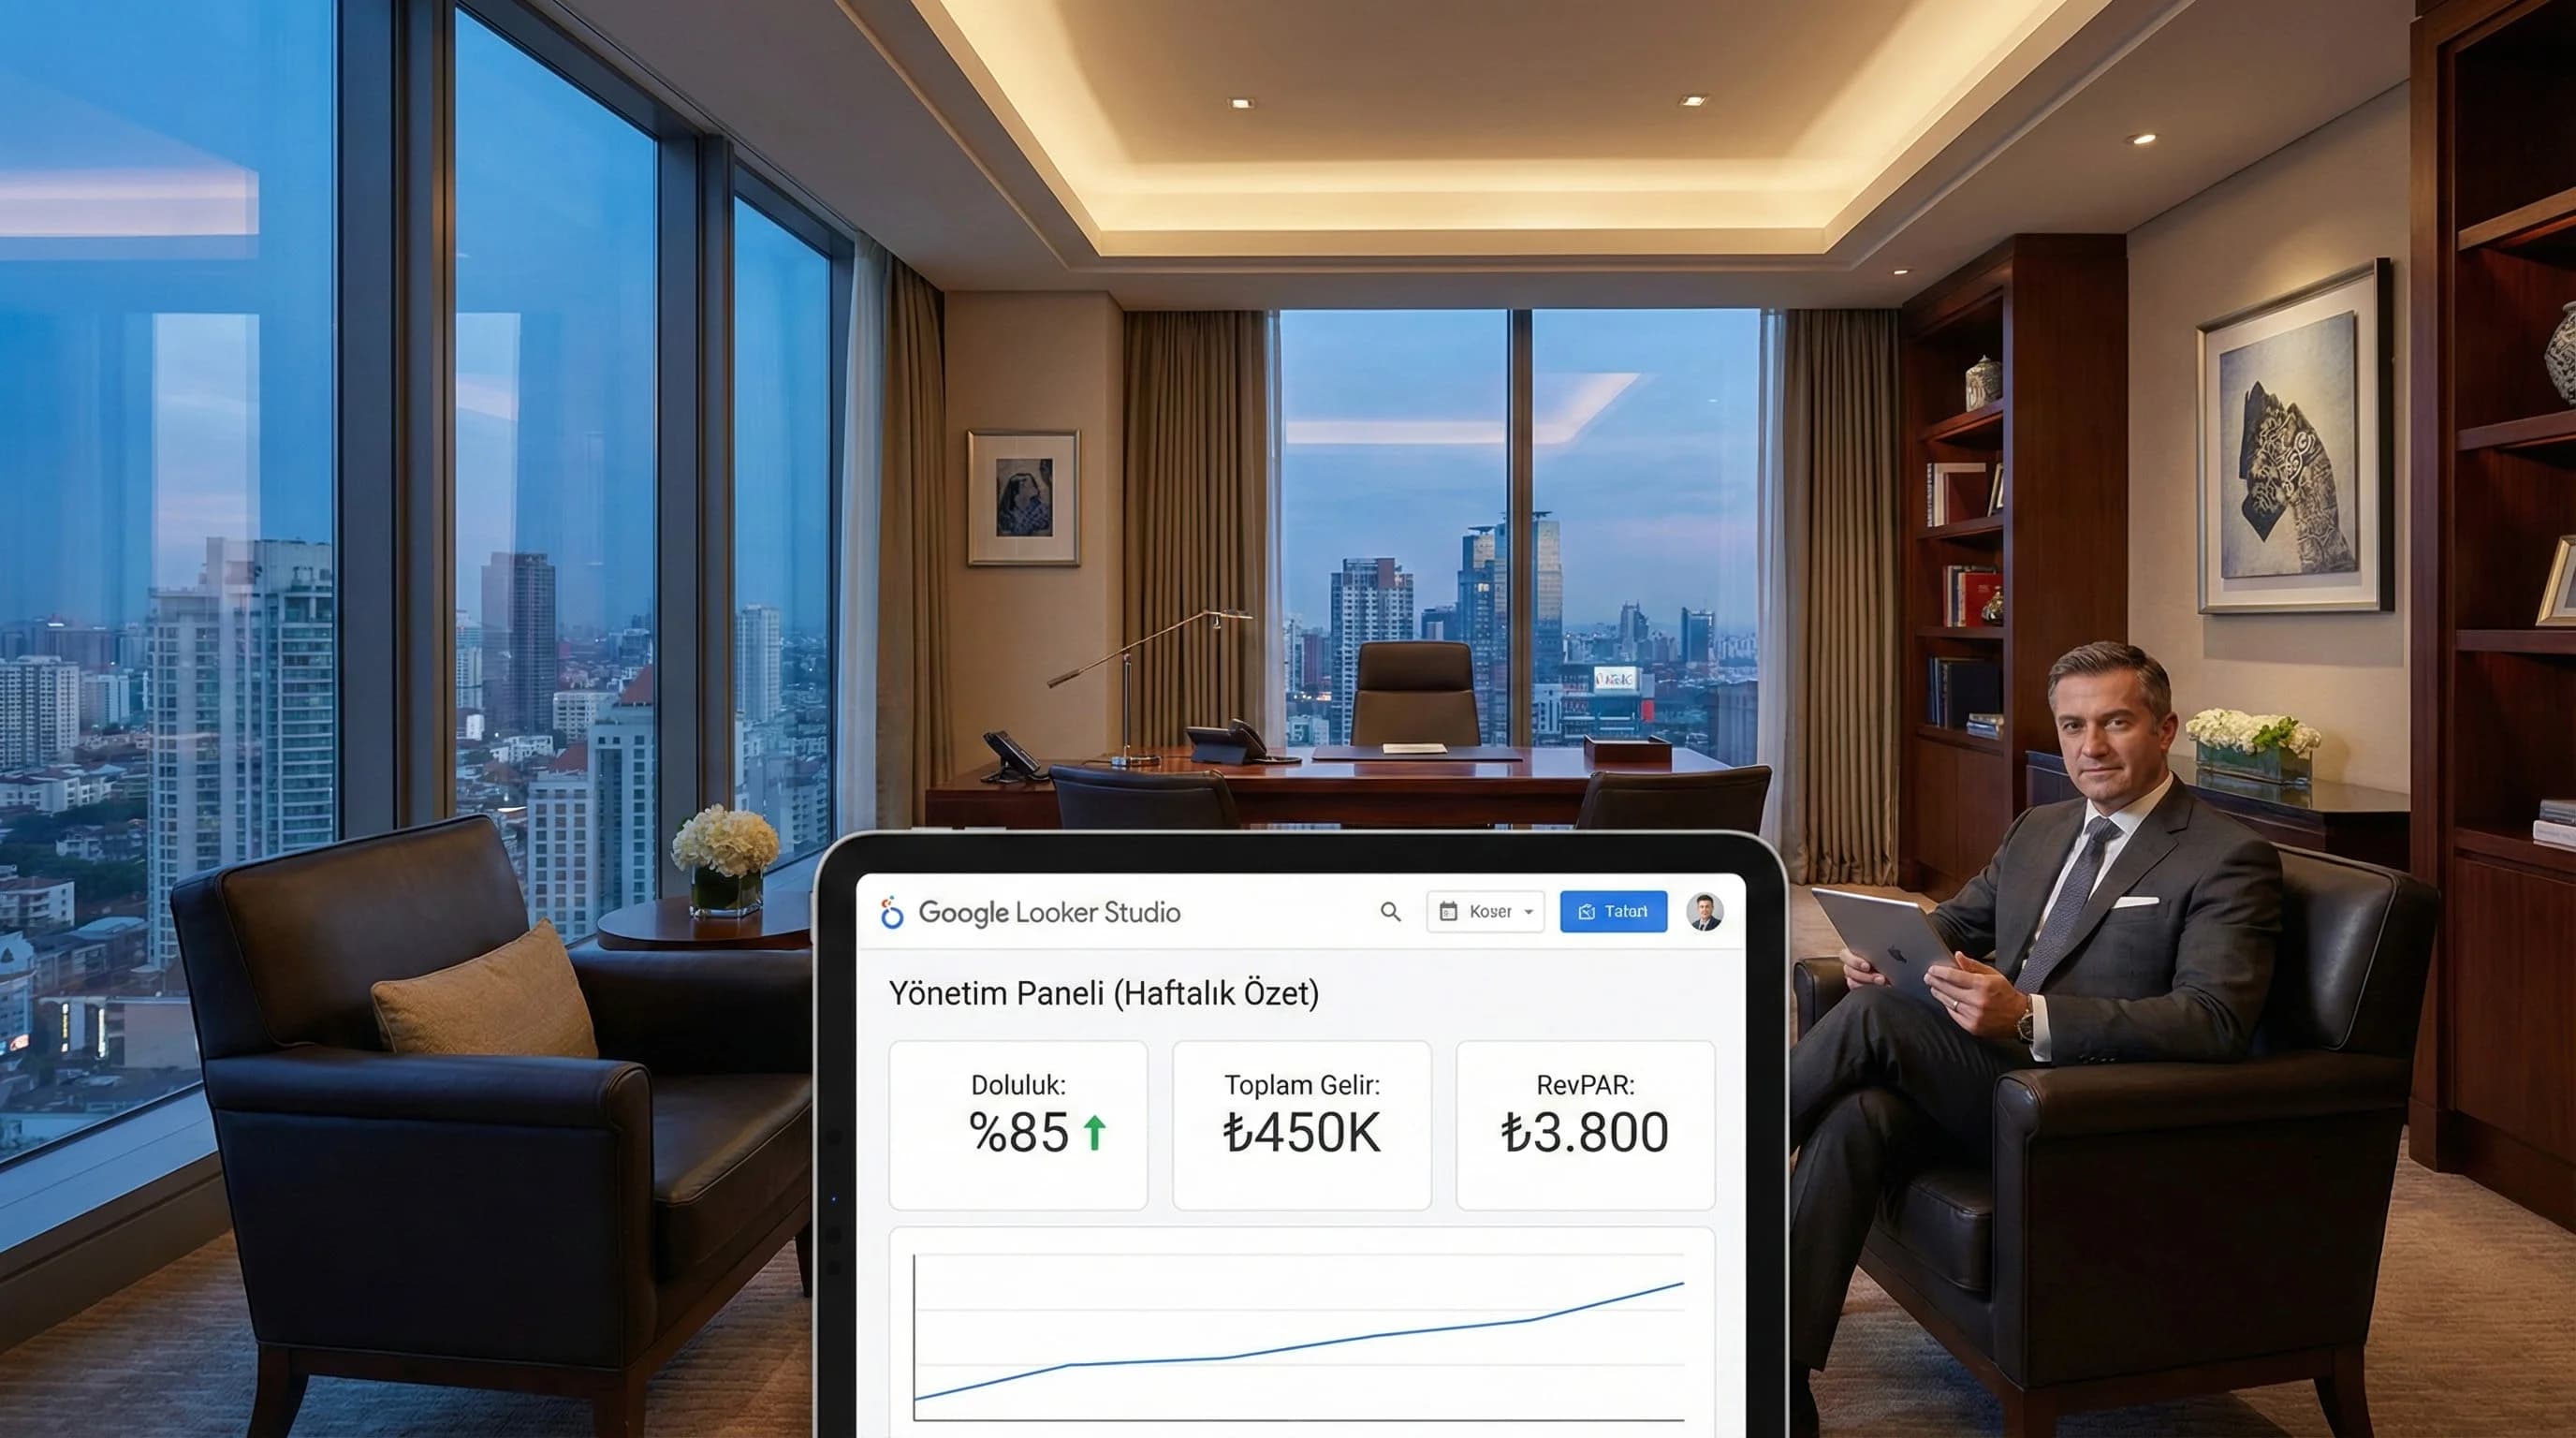
Executive dashboard is a "decision panel" that summarizes multi-channel data on a single screen. Best design; Layers 10–15 KPIs as summary cards at the top, trend and deviation in the middle, and channel contribution at the bottom. Every KPI should be answered with the question “what should we do?” The short notes linked to the action make the dashboard a management tool, not a report.
KPI selection + layout principles (item by item)
- •Number of KPIs: 10–15 (more will reduce decision speed)
- •KPI types: Outcome (revenue/RevPAR) + yield (ADR) + risk (if cancellation/no-show) + growth (booking conversion)
- •Single screen rule: Admin panel single page; details drill down
- •Trend rule: “last 7/30 days” trend and target deviation for each KPI
- •Channel rule: OTA/Web/Call Center + campaign performance summary
- •Decision rule: “3 actions this week” field in the panel
Mini Check
What should I do?
- •Lock KPI set at 15
- •Add 1 sentence “action note” to each KPI
- •Move detailed analyzes to separate pages
2. Determining the right set of KPIs for management (GM/Owner focused 10–15)
Management KPIs are different from departmental KPIs: the goal is to see the performance picture + risk + direction, not the “operations detail”. In seasonal destinations such as Antalya/Bodrum, the management panel should detect seasonal deviation early.
Recommended 12 KPI cores (hotel executive)
- •Occupancy
- •Revenue
- •ADR
- •RevPAR
- •Channel Mix (OTA/Web/Call Center share)
- •Booking / Lead volume (web/CRM)
- •Booking Conversion Rate (GA4/engine)
- •Paid Spend (Ads)
- •ROAS or CPA (campaign yield)
- •Organic Demand (brand search/organic trend)
- •Cancellation Rate (if any)
- •No-show Rate (if any)
Assumption (data point): The biggest value for management in most hotels is not to increase the number of metrics; It means being able to read the same set of KPIs in the same order every week.
Mini Check
What should I do?
- •Write KPI definitions as notes in the panel
- •Show channel mix as share + revenue
- •Add risk KPIs (cancel/no-show) as optional card
3. Executive dashboard design principles (wireframe logic)
Many competing articles are bogged down in technical details; Here, "readability" is essential for the management side. The “one panel instead of one slide” principle is based on three things: fast scanning, clear comparison, clear action.
Recommended layout (1 page)
- •Top row (KPI cards): Occupancy, Revenue, RevPAR, ADR, Channel Mix
- •Middle row (Trend + deviation): last 30 days trend + target/YoY benchmark (if applicable)
- •Bottom row (channel contribution): OTA/Web/Call Center + campaign summary
- •Bottom right (Action box): “3 actions this week” + owner + date
Mini Check
What should I do?
- •Standardize cards (size/title)
- •Do not put more than 2–3 charts in the GM panel
- •Link action box to meeting ritual
4. How to set up automatic Looker Studio reporting?
Short answer:
Prepare the report with sharing rules in Looker Studio to connect the Executive panel to a weekly/monthly rhythm; then schedule an automatic email/PDF sending cycle. Having the management take the same panel on the same day/time standardizes decision tracking.
Automatic email/PDF reporting in 6 steps
- •Recipient list: GM/Owner/board + department summaries (separate if necessary)
- •Timing: weekly (Mon) + monthly (1st of the month)
- •Content: executive page + benchmark (if any) + action area
- •Format: email body brief summary + PDF attachment (single page)
- •Authority: role-based access (not everyone can see everything)
- •Meeting rhythm: report → 10 min reading → 10 min action
Mini Check
What should I do?
- •Link weekly report to “fixed day/time”
- •Show only trend + deviation + decision note in monthly report
- •Keep PDF single page (for management)
5. Summary panels for different departments (without disrupting the admin panel)
It is possible to give departments their “own summary screen” without disrupting the executive panel. Thus, while the management remains on a single screen, teams produce actions with detailed screens.
Summary panel recommendations (brief)
- •Marketing: channel performance, ROAS/CPA, conversion trend
- •Sales/Revenue: occupancy, ADR/RevPAR, channel mix, cancellation/no-show
- •Operation: occupancy and room type/segment, guest flow (if applicable)
Mini Check
What should I do?
- •Leave the executive panel on one page
- •Position department pages as drill-down
- •Share links by role
6. How should the dashboard be used in management meetings? (answer in 10 minutes)
The purpose of this dashboard is to shorten the meeting, not extend it. Best practice is to use the panel with a “question set”.
Questions you can answer in 10 minutes
- •Are there any occupancy and RevPAR deviations this week?
- •Which hotel/segment did the revenue increase/decrease come from?
- •Has the channel mix changed (OTA/Web/Call Center)?
- •Is the Ads spend and the net result compatible (ROAS/CPA)?
- •If there is a decrease in conversion rate, where (funnel)?
- •Is there a risk signal (cancellation/no-show)?
- •What are our 3 actions this week?
Scenario (Assumption): In hotels using executive dashboards, when weekly management meetings are held from a single panel instead of Excel slides, time is shortened and action ownership becomes clearer.
7. Download Executive Dashboard Sample Template — Data Analysis & Reporting (v1.0)
Download Executive Dashboard Sample Template — Data Analysis & Reporting (v1.0)
This template allows you to quickly set up an executive panel with 10–15 KPIs in wireframe logic for hotels. Standardizes KPI layout, “trend + deviation + channel contribution” layout and meeting action box. With its weekly/monthly automatic report cycle, it makes it easier for management to make decisions based on the same summary.
Kim Kullanır?
GM, Owner, head office management; sales-marketing/revenue teams that prepare the report.
Nasıl Kullanılır?
- Lock KPI definitions (revenue source, RevPAR formula, channel mix).
- Fill out the template in Looker Studio: cards → trend → channel contribution → action box.
- Schedule your weekly/monthly email report on the same panel.
Ölçüm & Önceliklendirme (Kısa sürüm)
PDF içinde: Problem→Kök Neden→Çözüm tablosu + 14 gün sprint planı + önce/sonra KPI tablosu
Bir Sonraki Adım
For hotels that want to establish KPI standards and automatic reporting routines at GM/Owner level